Statistical Process Control (SPC)
Determine Measurement Method
Statistical Process Control is based on the analysis of data, so the first step is to decide what data to collect. There are two categories of control chart distinguished by the type of data used: Variable or Attribute.
Variable data comes from measurements on a continuous scale, such as: temperature, time, distance, weight. Attribute data is based on upon discrete distinctions such as good/bad, percentage defective, or number defective per hundred.
Qualify the Measurement System
A critical but often overlooked step in the process is to qualify the measurement system. No measurement system is without measurement error. If that error exceeds an acceptable level, the data cannot be acted upon reliably. For example: a Midwest building products manufacturer found that many important measurements of its most critical processes had error in excess of 200% of the process tolerance. Using this erroneous data, the process was often adjusted in the wrong direction - adding to instability rather than reducing variability.
Initiate Data Collection and SPC Charting
Develop a sampling plan to collect data (subgroups) in a random fashion at a determined frequency. Be sure to train the data collectors in proper measurement and charting techniques. Establish subgroups following a rational subgrouping strategy so that process variation is captured BETWEEN subgroups rather than WITHIN subgroups. If process variation (e.g. from two different shifts) is captured within one subgroup, the resulting control limits will be wider, and the chart will be insensitive to process shifts.
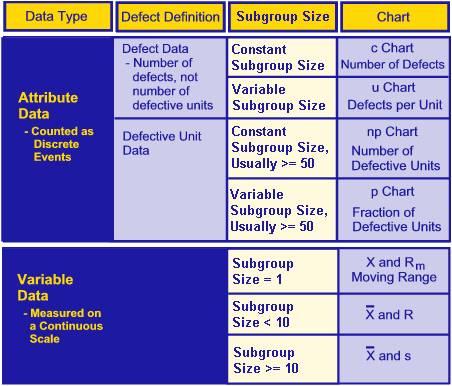
The type of chart used will be dependent upon the type of data collected as well as the subgroup size, as shown by the table below. A bar, or line, above a letter denotes the average value for that subgroup. Likewise, a double bar denotes an average of averages.
Consider the example of two subgroups, each with 5 observations. The first subgroup's values are: 3,4,5,4,4 - yielding a subgroup average of 4 (x̄1). The second subgroup has the following values: 5,4,5,6,5 - yielding an average of 5 (x̄2). The average of the two subgroup averages is (4 + 5)/2 = 4.5, which is called X double-bar (̿x), because it is the average of the averages.

About Us
AECA is a privately owned, ISO9001:2015 certified. State of the art precision machining facility. That is continually evolving as we strive to stay at the forefront of machining and manufacturing.
We provide a complete range of components from small pin to highly complex assemblies .Our machining capabilities are backed by highly skilled machinists, an ERP system, experienced engineering personnel backed by our quality system that helps us to maintain a superior level of service to our customers. The well trained and knowledgeable program management staff at AECA is at hand to support and provide all relevant information and status updates on customer account/programs.


